

I graphed the annual percent change of inflation (CPI) in the United States from 1774 to 2007 and then added a graph of the CPI index. This index takes $100 in 2007 and shows what the equivalent dollar amount is for each year (so in 1774 that would be $3.77). However, this does not represent the changes in the standard of living, given the invention of new technology.
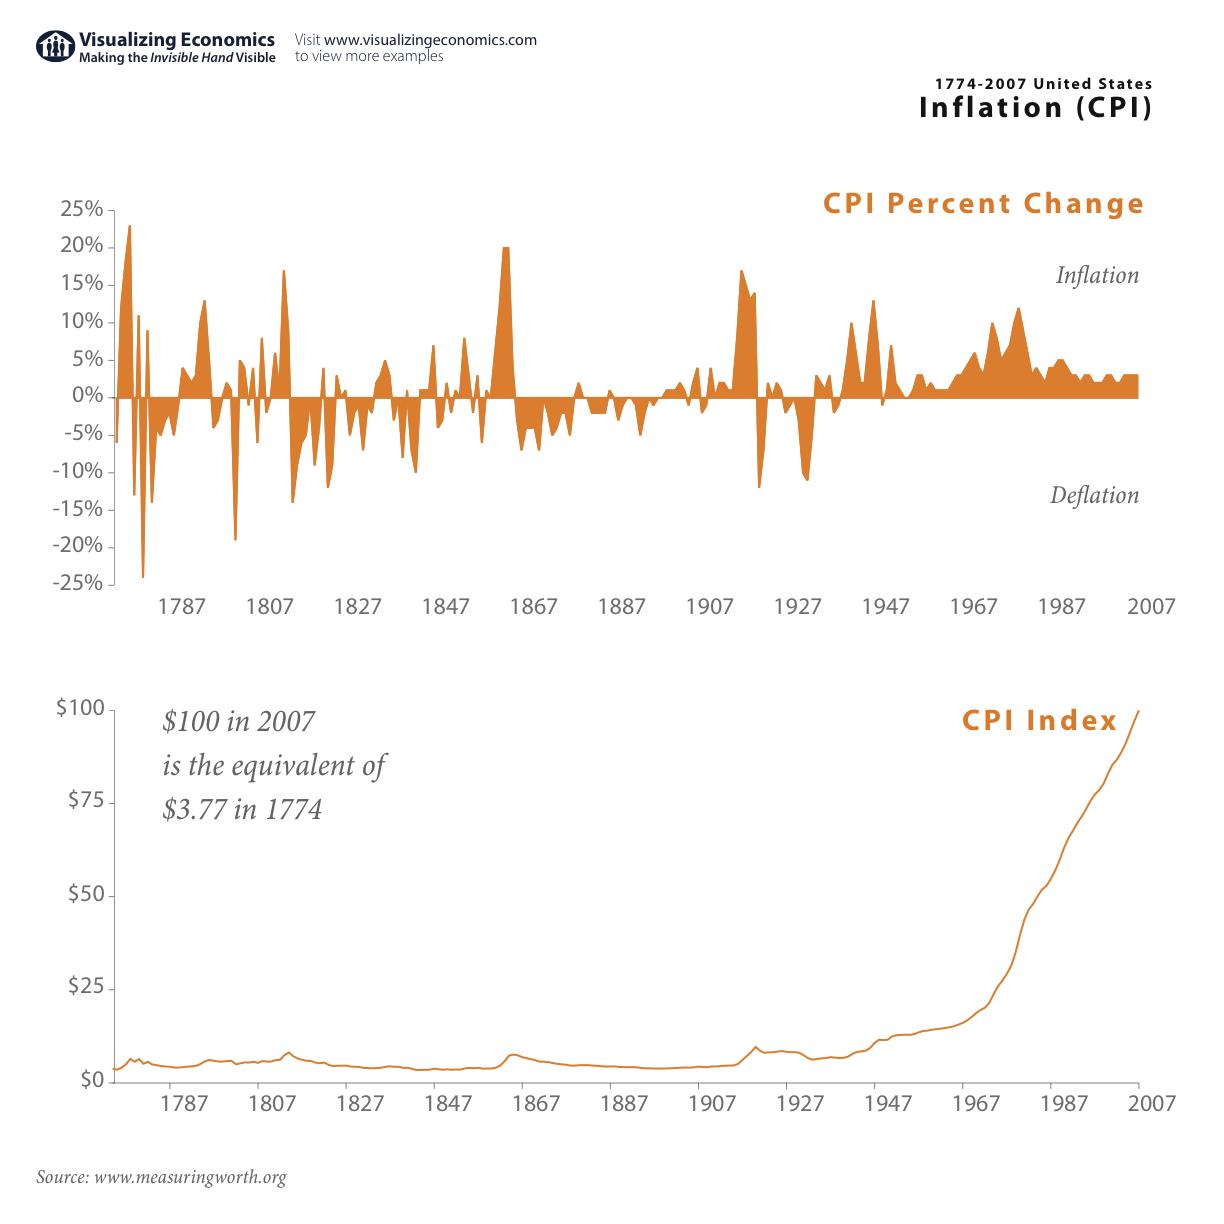
Data from MeasuringWorth.org