
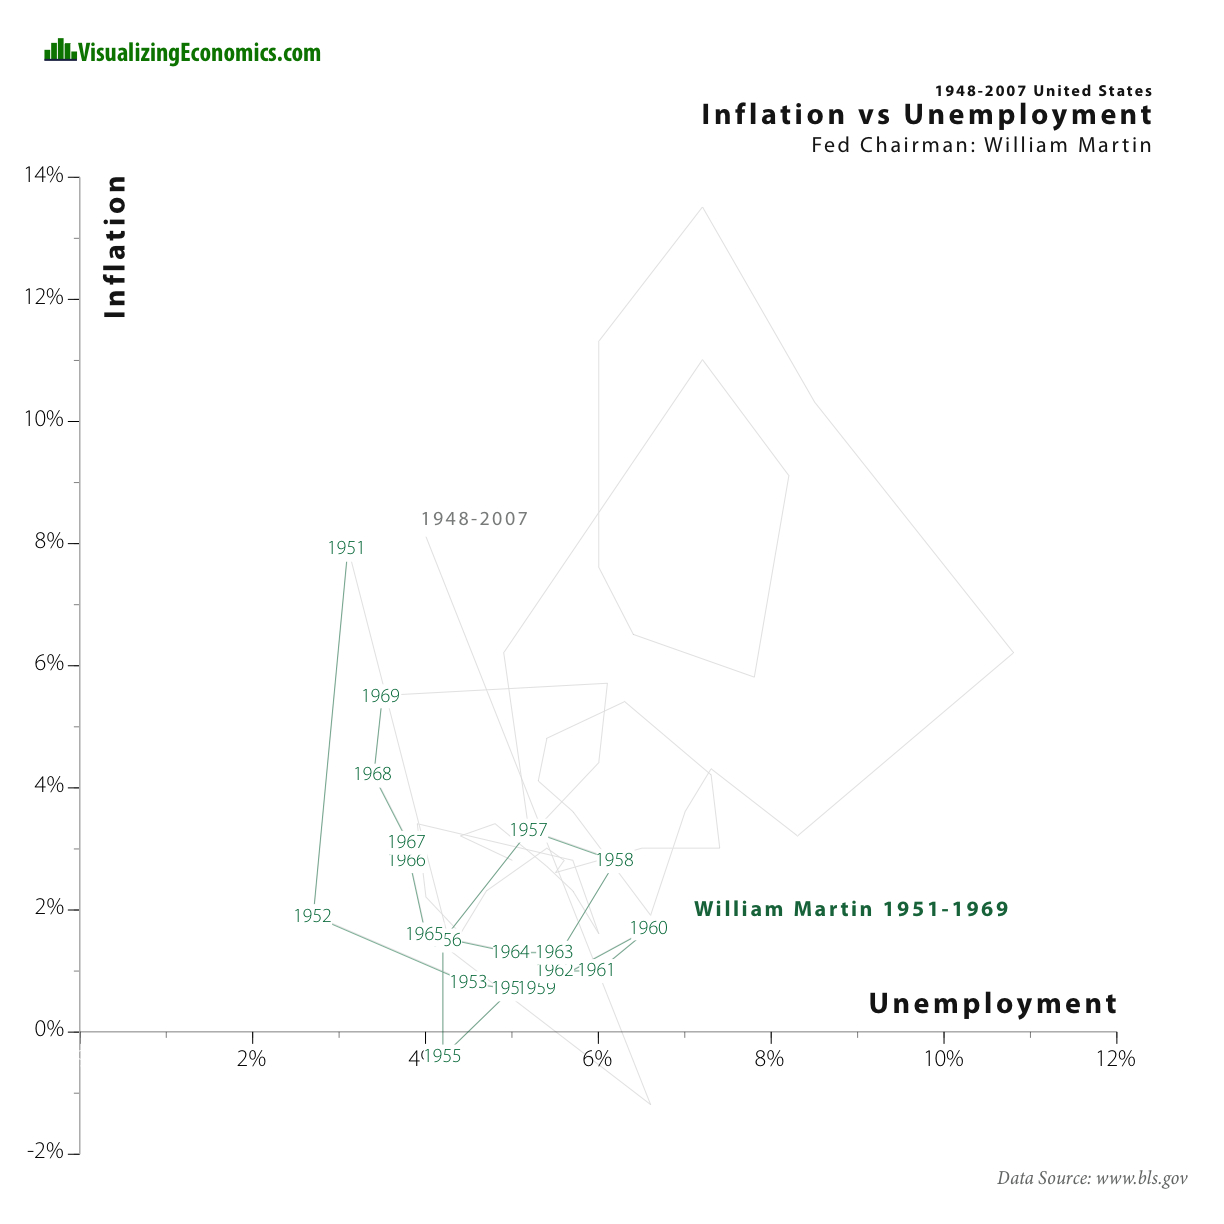
I have plotted the annual inflation (CPI-U) vs unemployment. The green line represents the time William Martin was the Fed Chairman (April 2, 1951 – February 1, 1970). The gray line represent the years 1948-2007. In traditional economic theory, the Phillips curve describes the inverse relationship between inflation and unemployment, i.e. when inflation is high, unemployment is low. This was true in the United States in the 60s but not other time periods
{Click on the image to take a closer look}
![]()
Data from Bureau of Labor Statistics
[tags]United States, Inflation, Unemployment[/tags]