

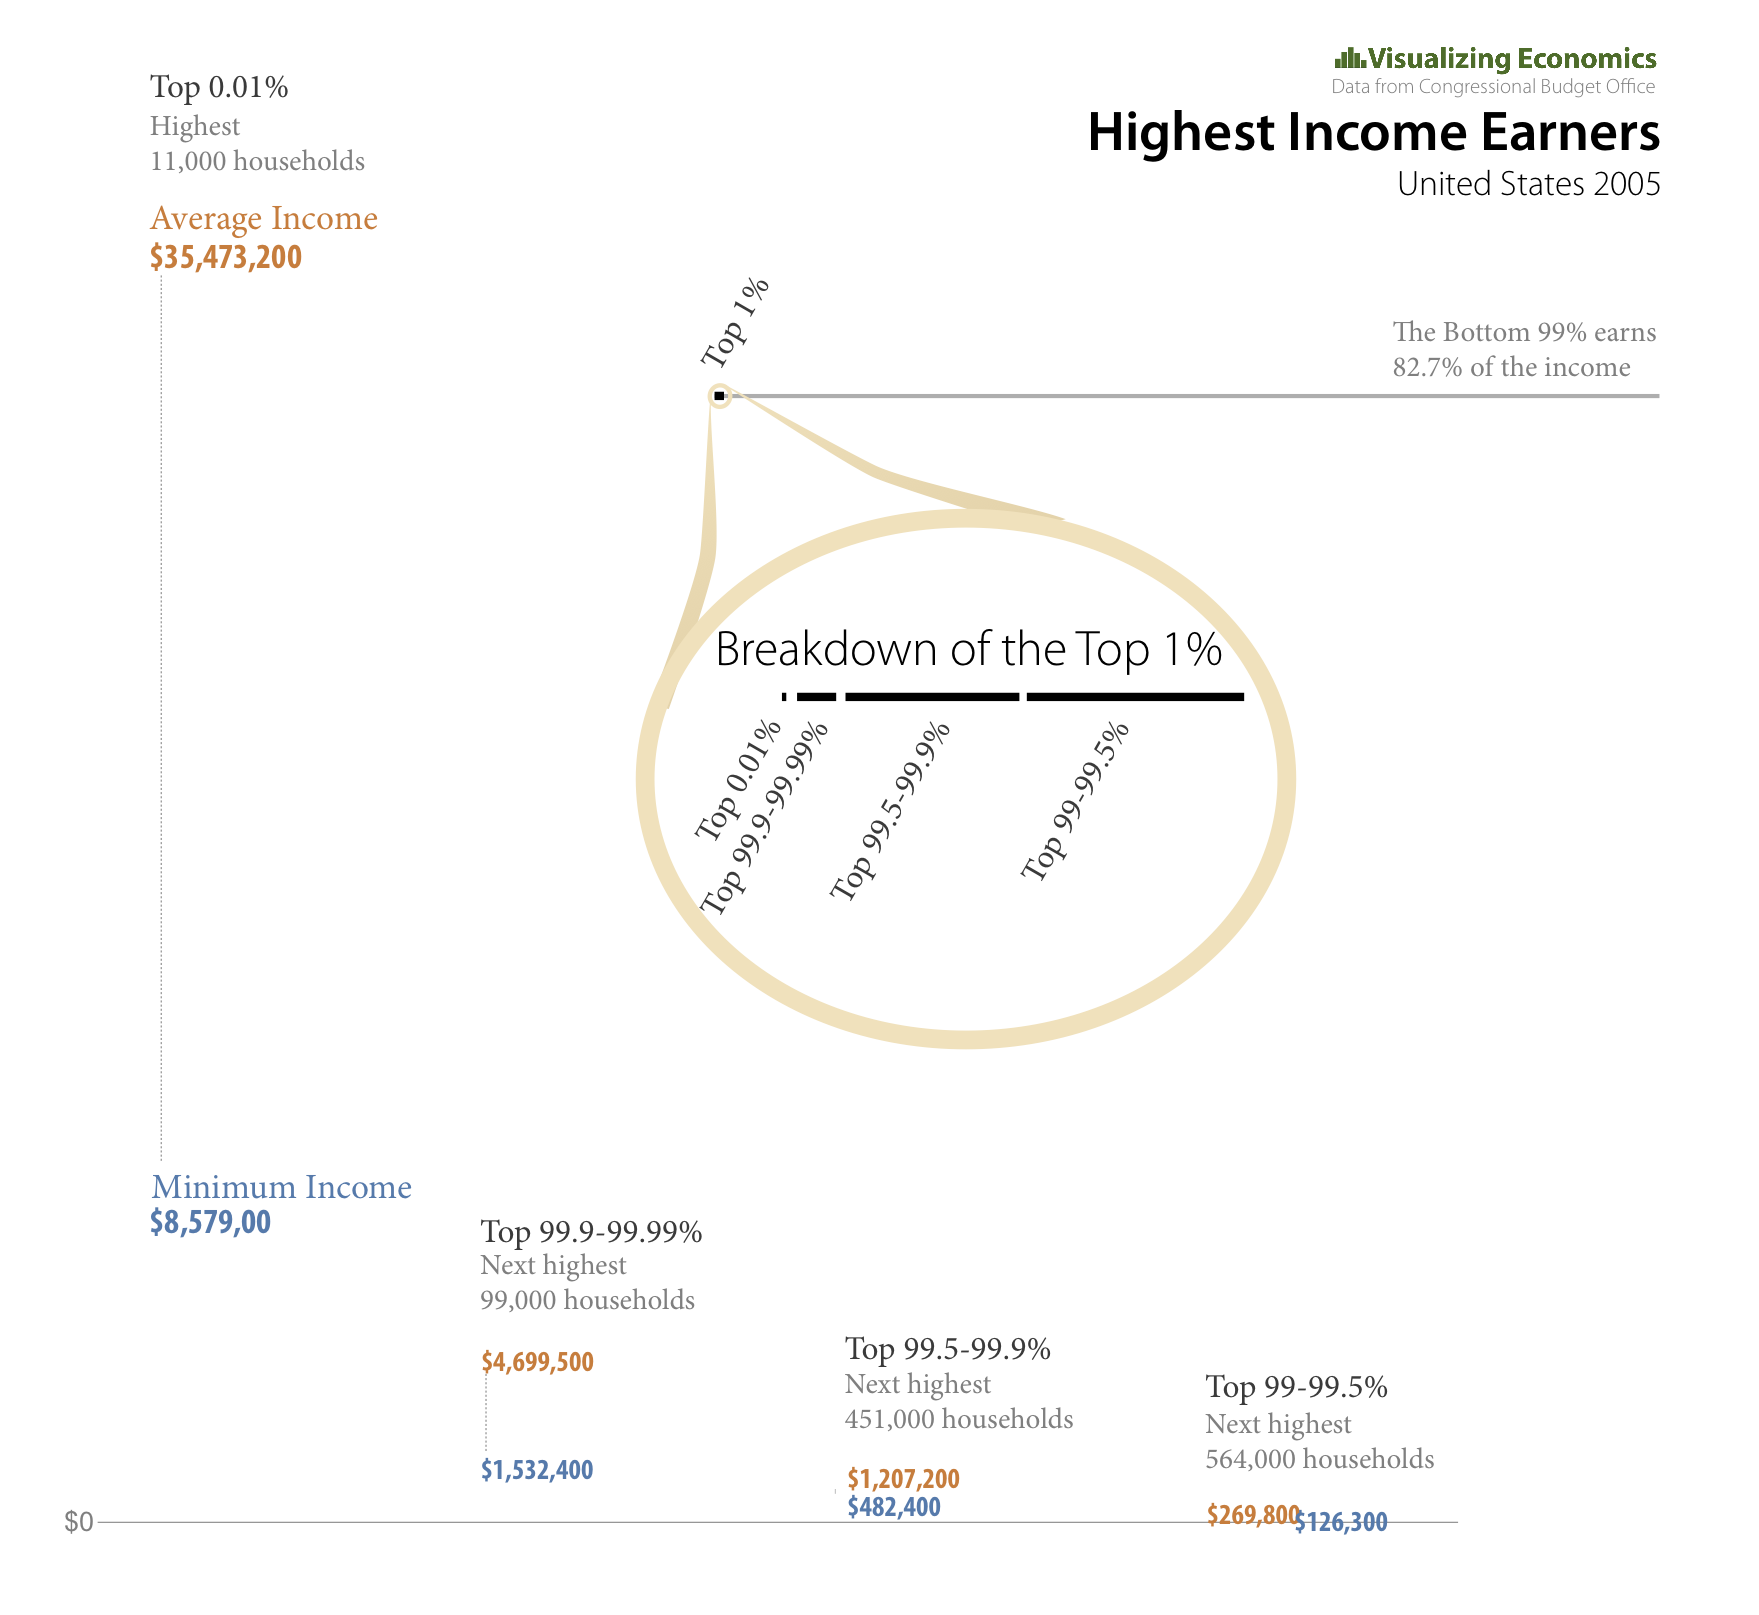
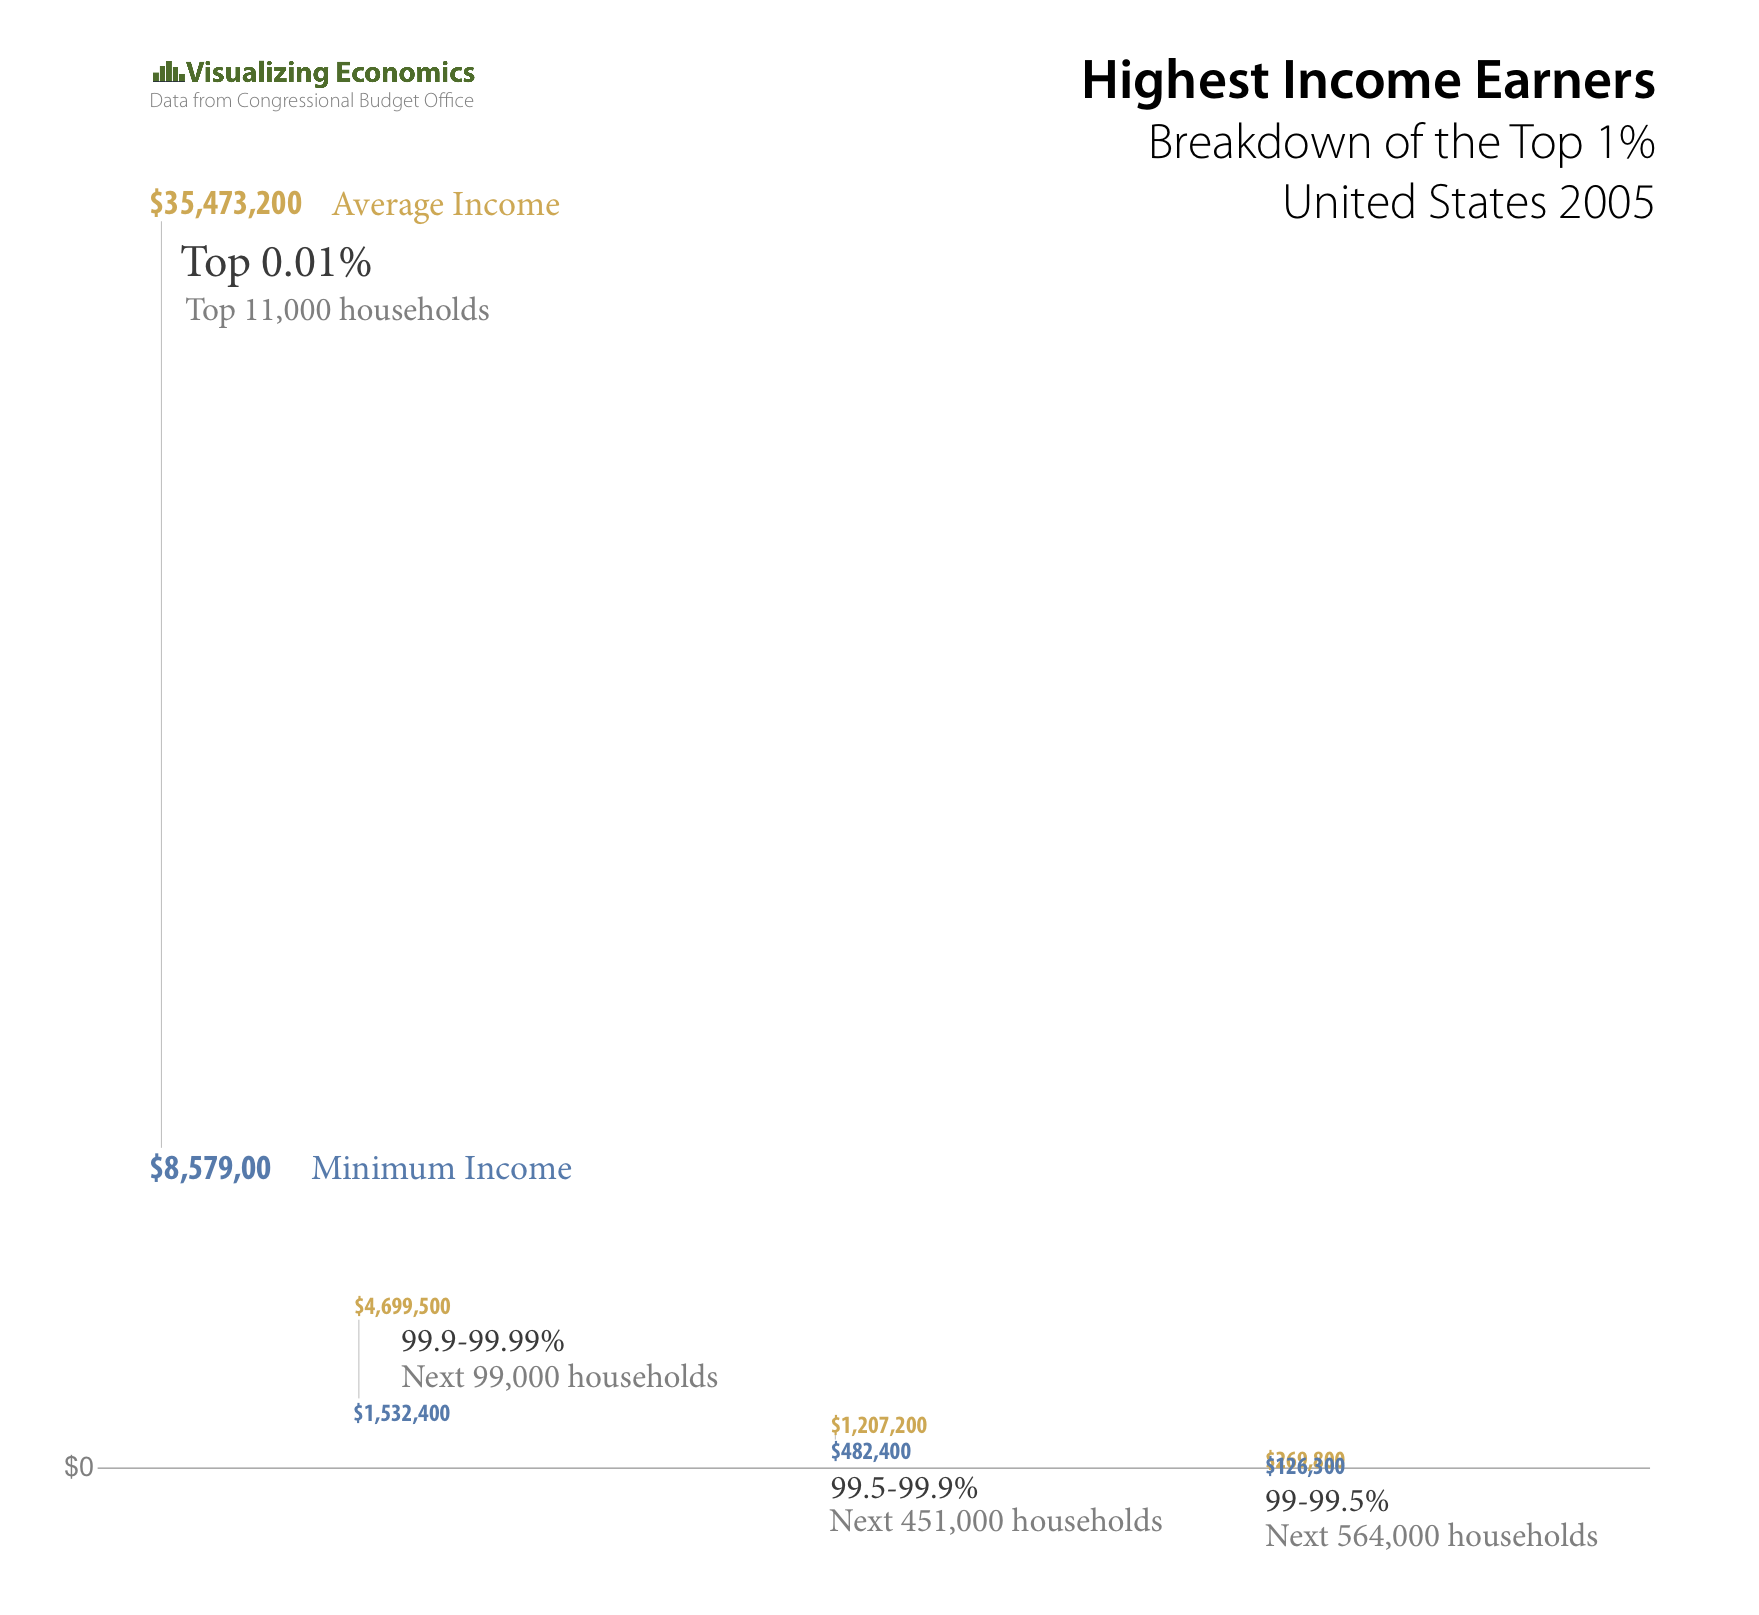
ADDED NEW VERSION 2/10/2009 Recently the CBO published a supplement to their Historical Effective Federal Tax Rates: 1979 to 2005 report to include a breakdown of top 1% into smaller percentiles. I took the data for income and created this visualization. It is comparing the minimum income for each percentile to the average income in that percentile.
UPDATED VERSION {Click on the image to take a closer look}

ORIGINAL VERSION {Click on the image to take a closer look}
Data from Congressional Budget Office