Mastodon

Occupations

Employment of 25-54 yrs vs 55 and over: 2004-2008

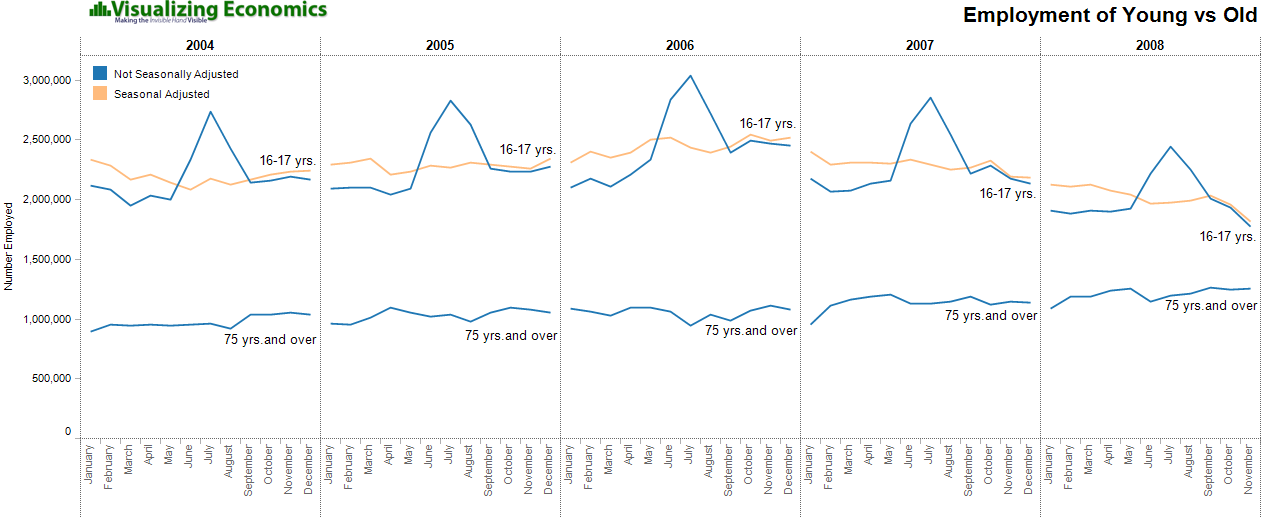
Building on Employment of Young vs Old graph, this week I am comparing of the number of employed 25-54 year olds to number of workers above 55. The top graph is the ratio of 25-54 year olds employed for everyone over 55 employed. The second graph shows just the total number employed by age. {Click on the image to take a closer look}
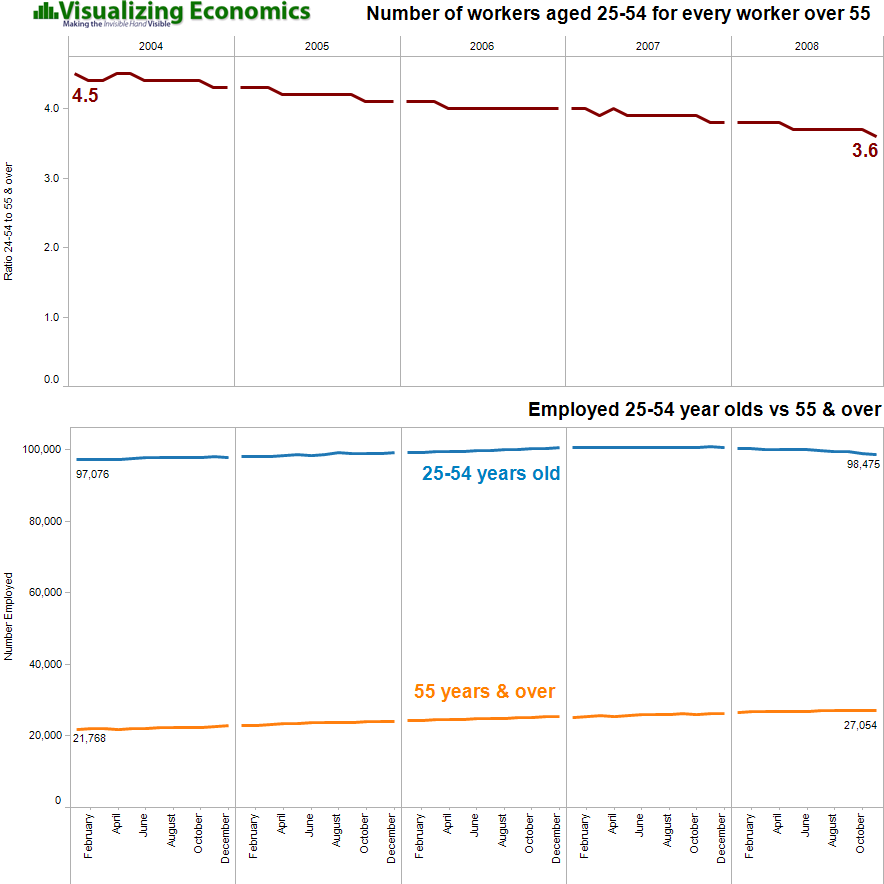
Unemployment
magnifying glass
Related Posts Plugin for WordPress, Blogger...

Employment of Young vs Old: 2004-2008

Inspired by last week's graph on Job Loss by Age, I created this 5 year comparison of the number of employed 16-17 year olds to number of workers above 75. There are two methods for measuring 16-17 year olds: not seasonally adjusted and seasonally adjusted which removes the effects of events like summer employment that follow a more or less regular pattern each year. {Click on the image to take a closer look}

Unemployment
magnifying glass
Related Posts Plugin for WordPress, Blogger...

Highest Paid American Athletes 2007

In honor of the Super Bowl, I am posting Sports Illustrated's Fortunate 50 top-earning American athletes (earnings include salary, winnings, bonuses, and endorsements). However, only one of the players in today's game made the list, Tom Brady of the New England Patriots, Rank: 47. 

Income of United States, Japan, India, China, and Indonesia since 1500

I found a nice table of this data on SportsColumn.com. Salaries are based on current or most recently completed seasons (exception: 2007 for NFL). For winnings-based sports (auto racing, golf, tennis), 2006 calendar year amounts used.

Related Posts Plugin for WordPress, Blogger...