Mastodon

Stocks

Taxing Businesses: Decline of Listed Companies on Stock Exchange

Part 4 of a series about Taxing Businesses

This is an intriguing graph showing the decline of companies listed in the United States on the stock exchange. (These companies would be corporations whose's stocks are freely traded on a stock exchange, not pass-throughs).

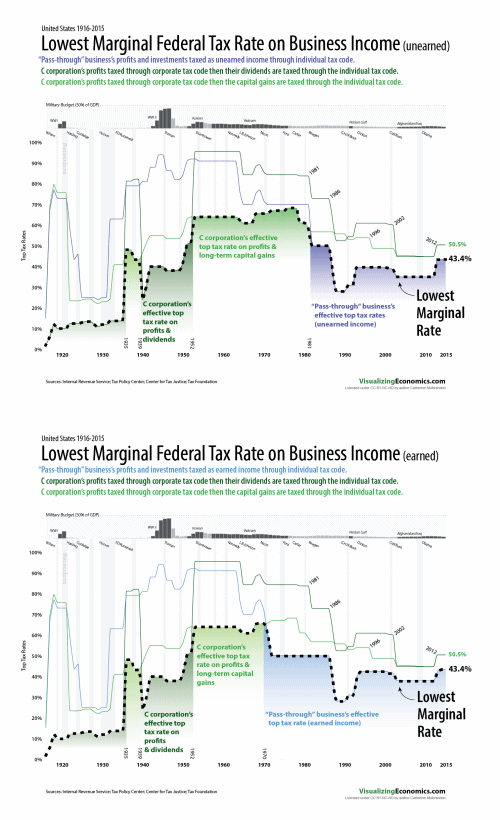
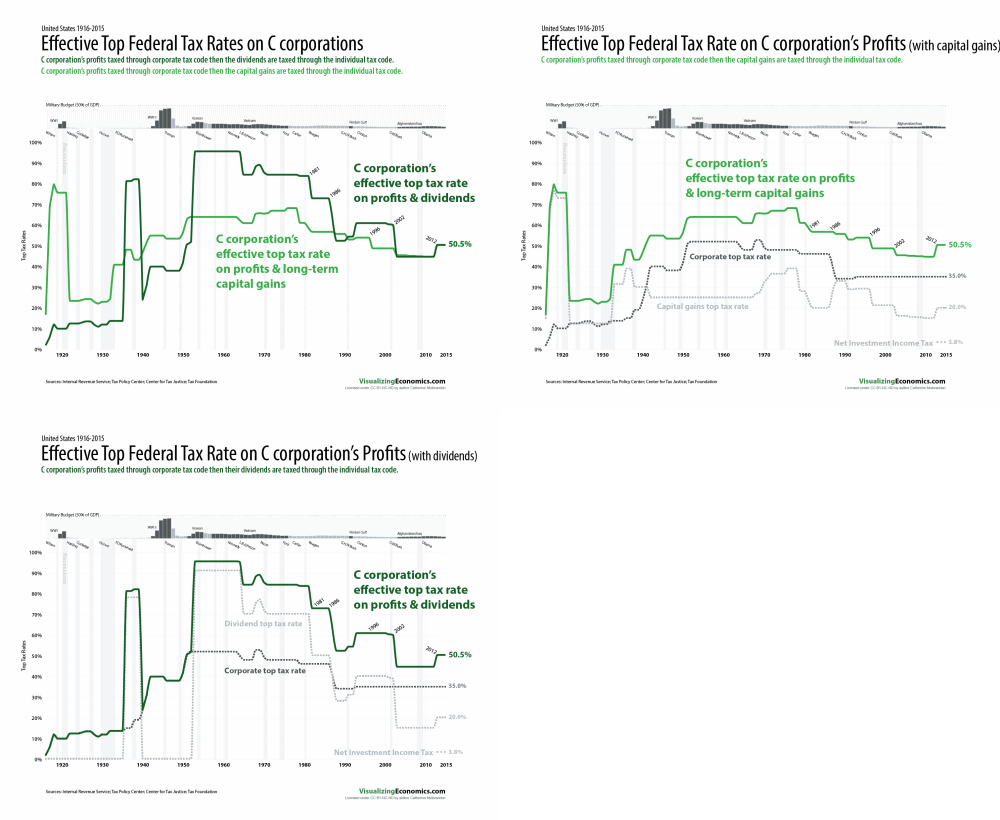
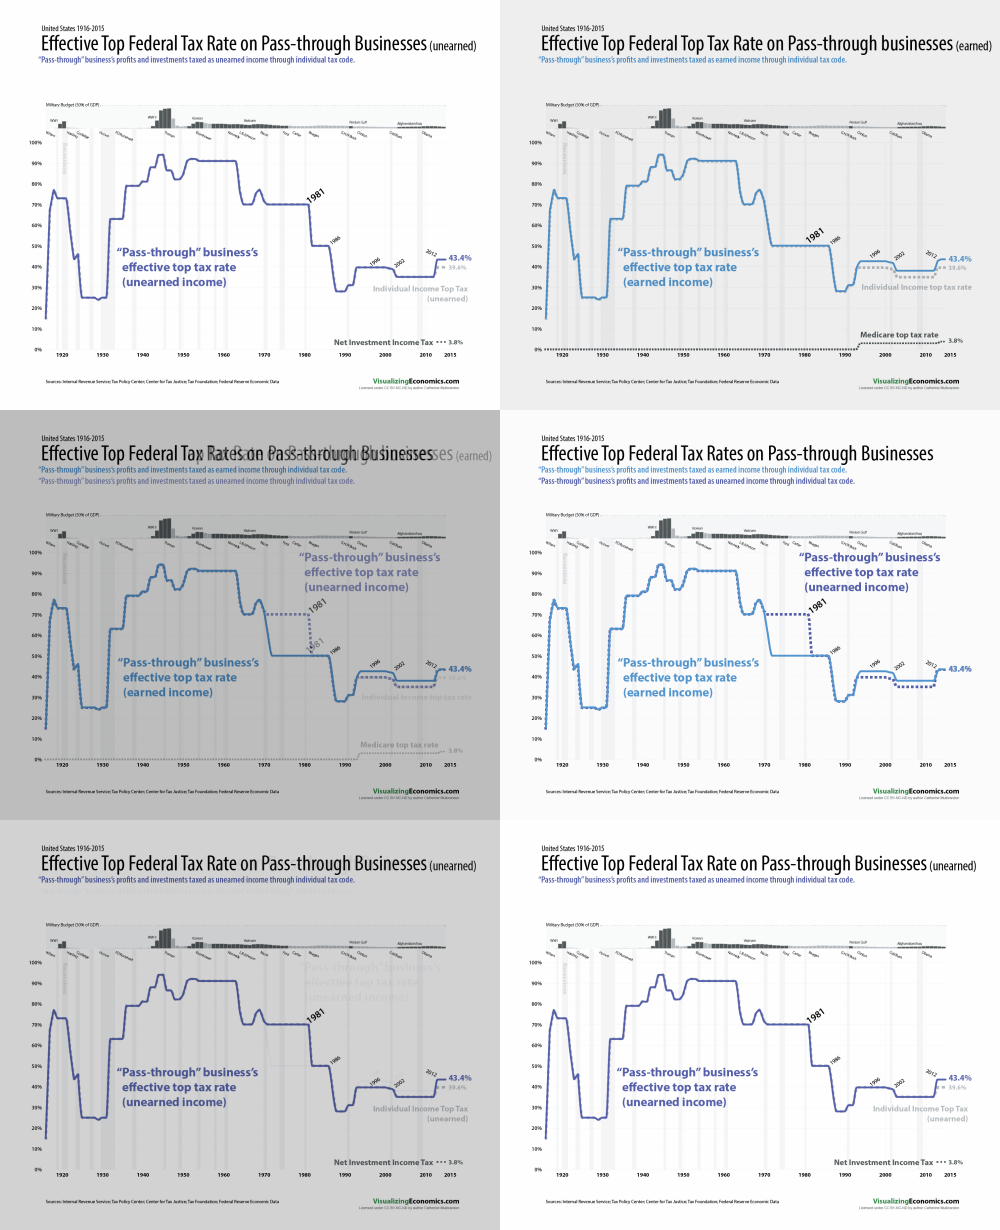
The tax changes in the 80s provided a tax incentive to change the business structure from C corporation to pass-throughs like LLCs. Originally, the IRS was very strict as to when a business could be treated a pass-through entity, however, that changed on January 1, 1997. That is when you see the ratio of listed companies the stock exchange drop dramatically.

Data Notes: Federal Reserve Economic Data (FRED); Historical Data for listed companies The U.S. listing gap Craig Doidge, G. Andrew Karolyi, and René M. Stulz 

  • FRED code for Number of Listed Companies for the United States (DDOM01USA644NWDB)

  • FRED code for Civilian Noninstitutional Population (CNP16OV)

Related Posts Plugin for WordPress, Blogger...

Monthly Volatility of the U.S. Stock Market

My last volatility graph, this time looking at monthly price change instead of daily or weekly. The S&P 500 daily price data is from the Yahoo finance via Qunadl

BTW, if you want learn more about how I do what I do, pledge on Patreon and get a behind-the-scenes peek every month.


(updated graph 7/29 to fix a typo)

Related Posts Plugin for WordPress, Blogger...

Real Rolling Gold Returns Compared to Stocks 1928-2013

An update of a previous post comparing the average compound rolling returns (adjusted for inflation) for both stocks and gold over 1, 5, 10, 15, 20, 25, 30, 35 and 40 year intervals. 

For the period 1928-2013, the average annual compound real return of stocks = 6.3% and gold = 2.0%. However, the price of gold was controlled by the government until the mid-70s when the US finally abandoned the gold standard. For the period 1976-2013, the average returns were stocks = 7.2% and gold = 2.0%. 

Gold Data from MeasuringWorth. Stock data from Damodaran Online | Updated Data | Historical Returns on Stock Bonds and Bills - United States.  CPI from Measuring Worth

Graphs created in OmniGraphSketcher then pasted into Illustrator

Related Posts Plugin for WordPress, Blogger...