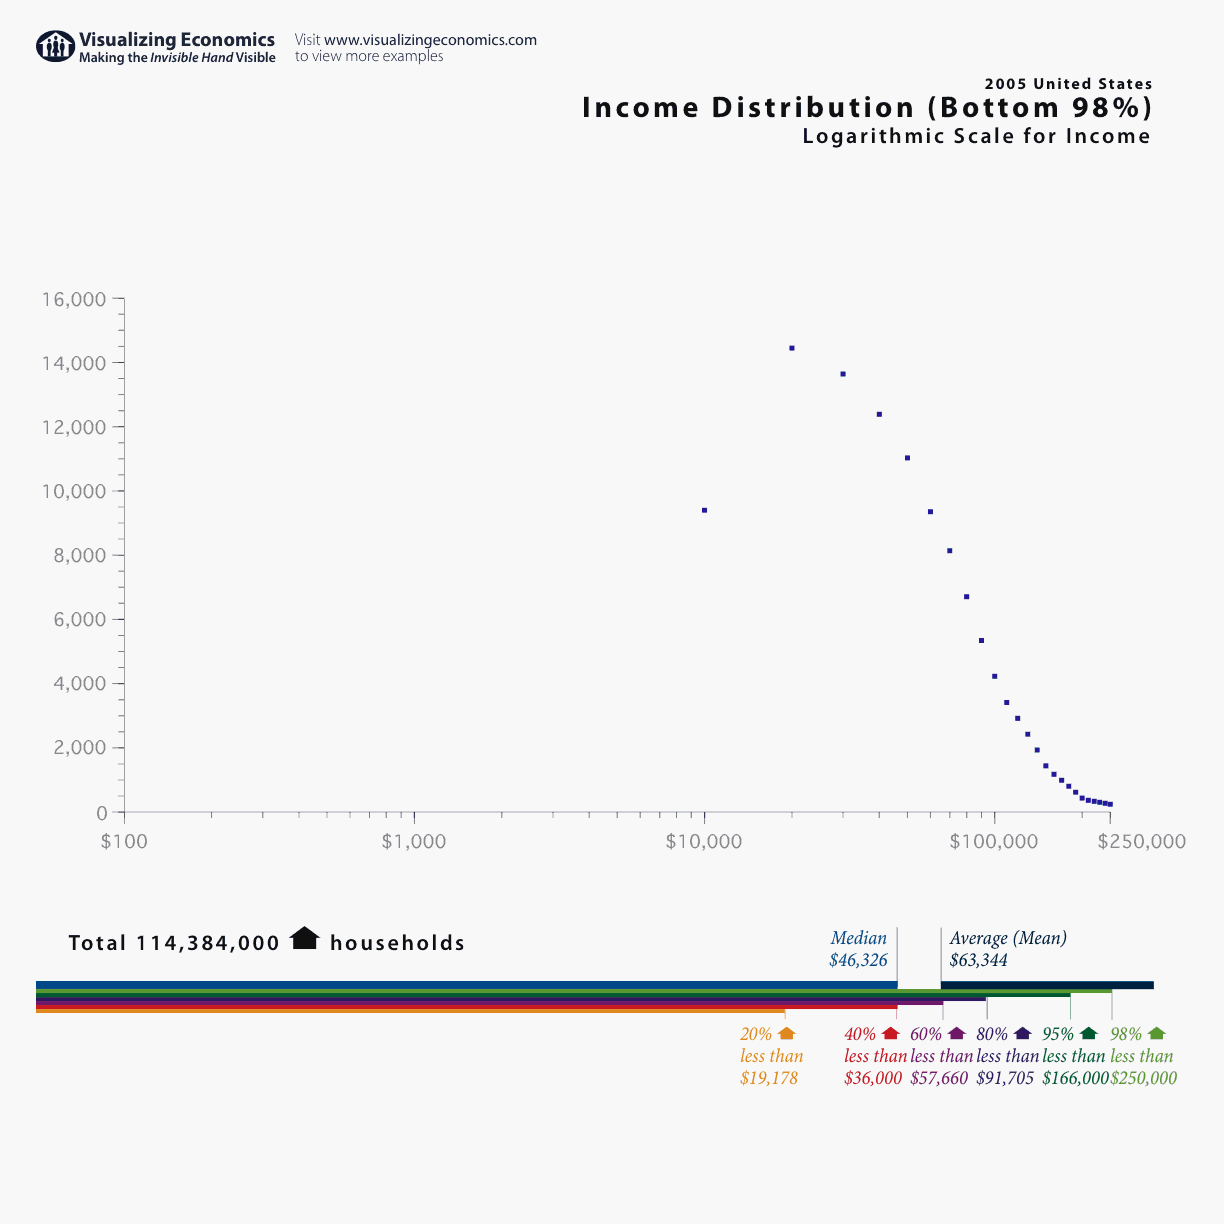

I went back to my 2005 US Income Distribution graph and changed the scale to match the logarithmic scale used in Gapminder's World income distribution 2003 graph which shows the historical income distribution from 1970-2000 for selected countries. {Click on the graph to take a closer look}

