Mastodon

Pitketty_Saez

Four Ways to Visualize US Income Inquality

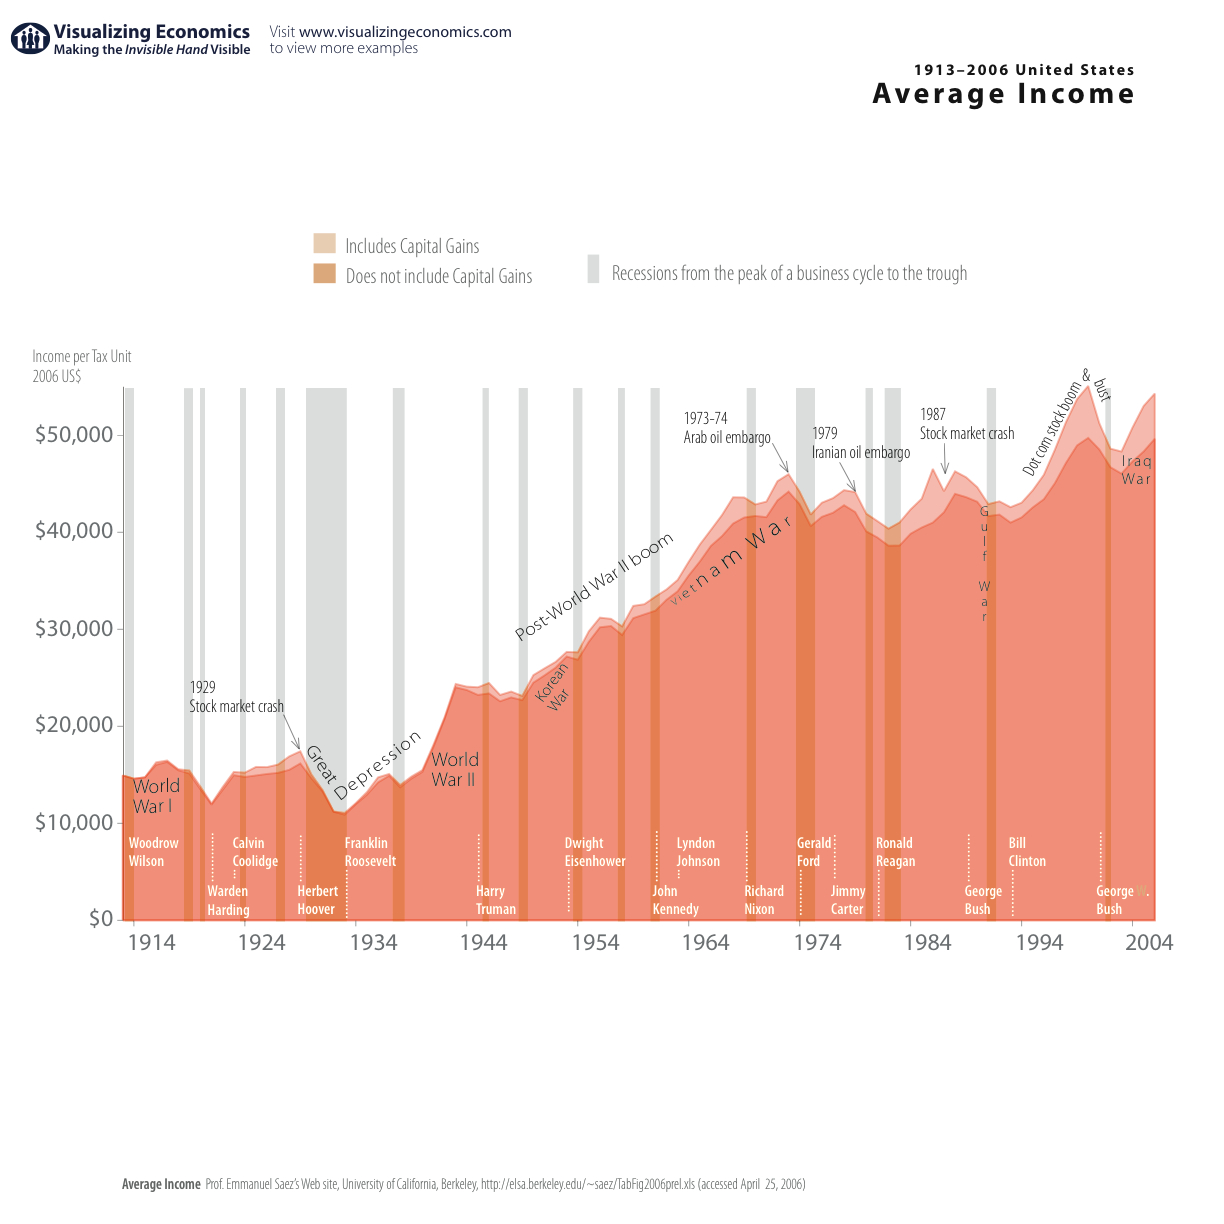
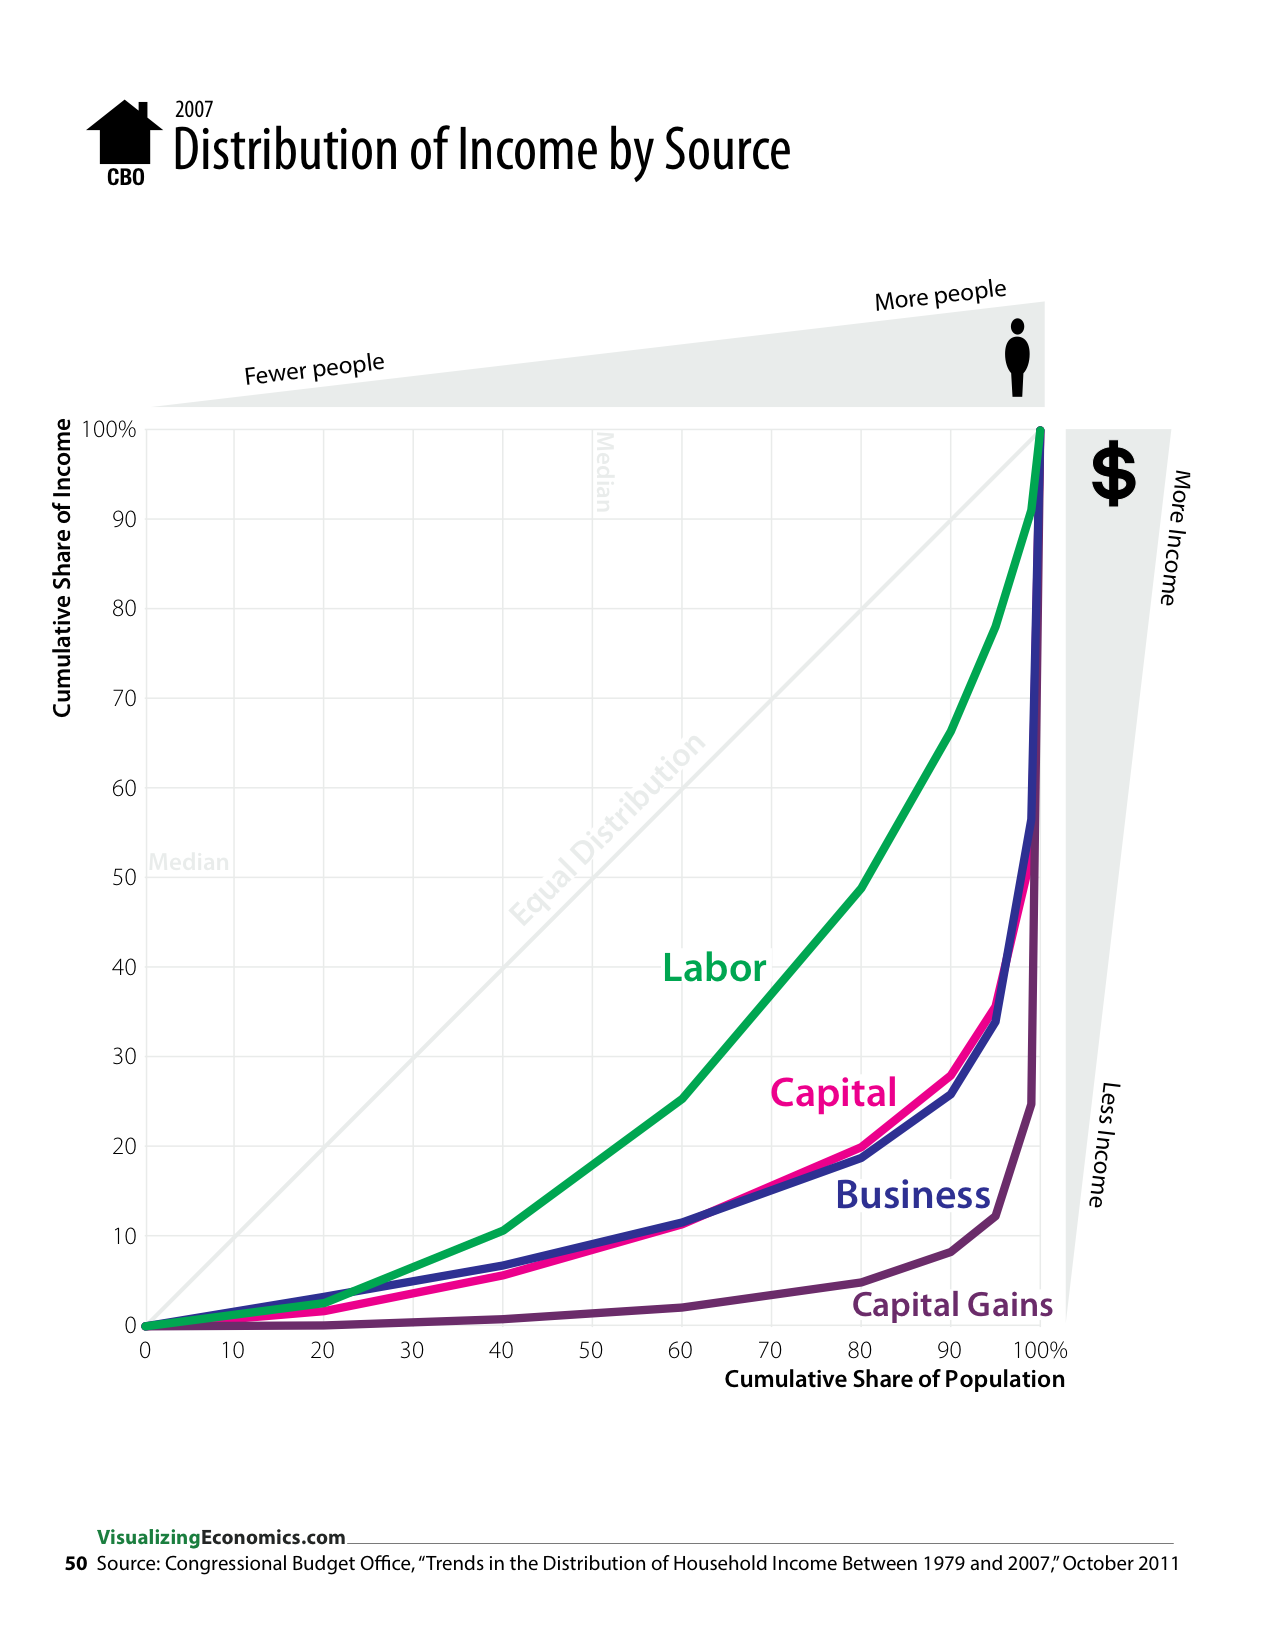
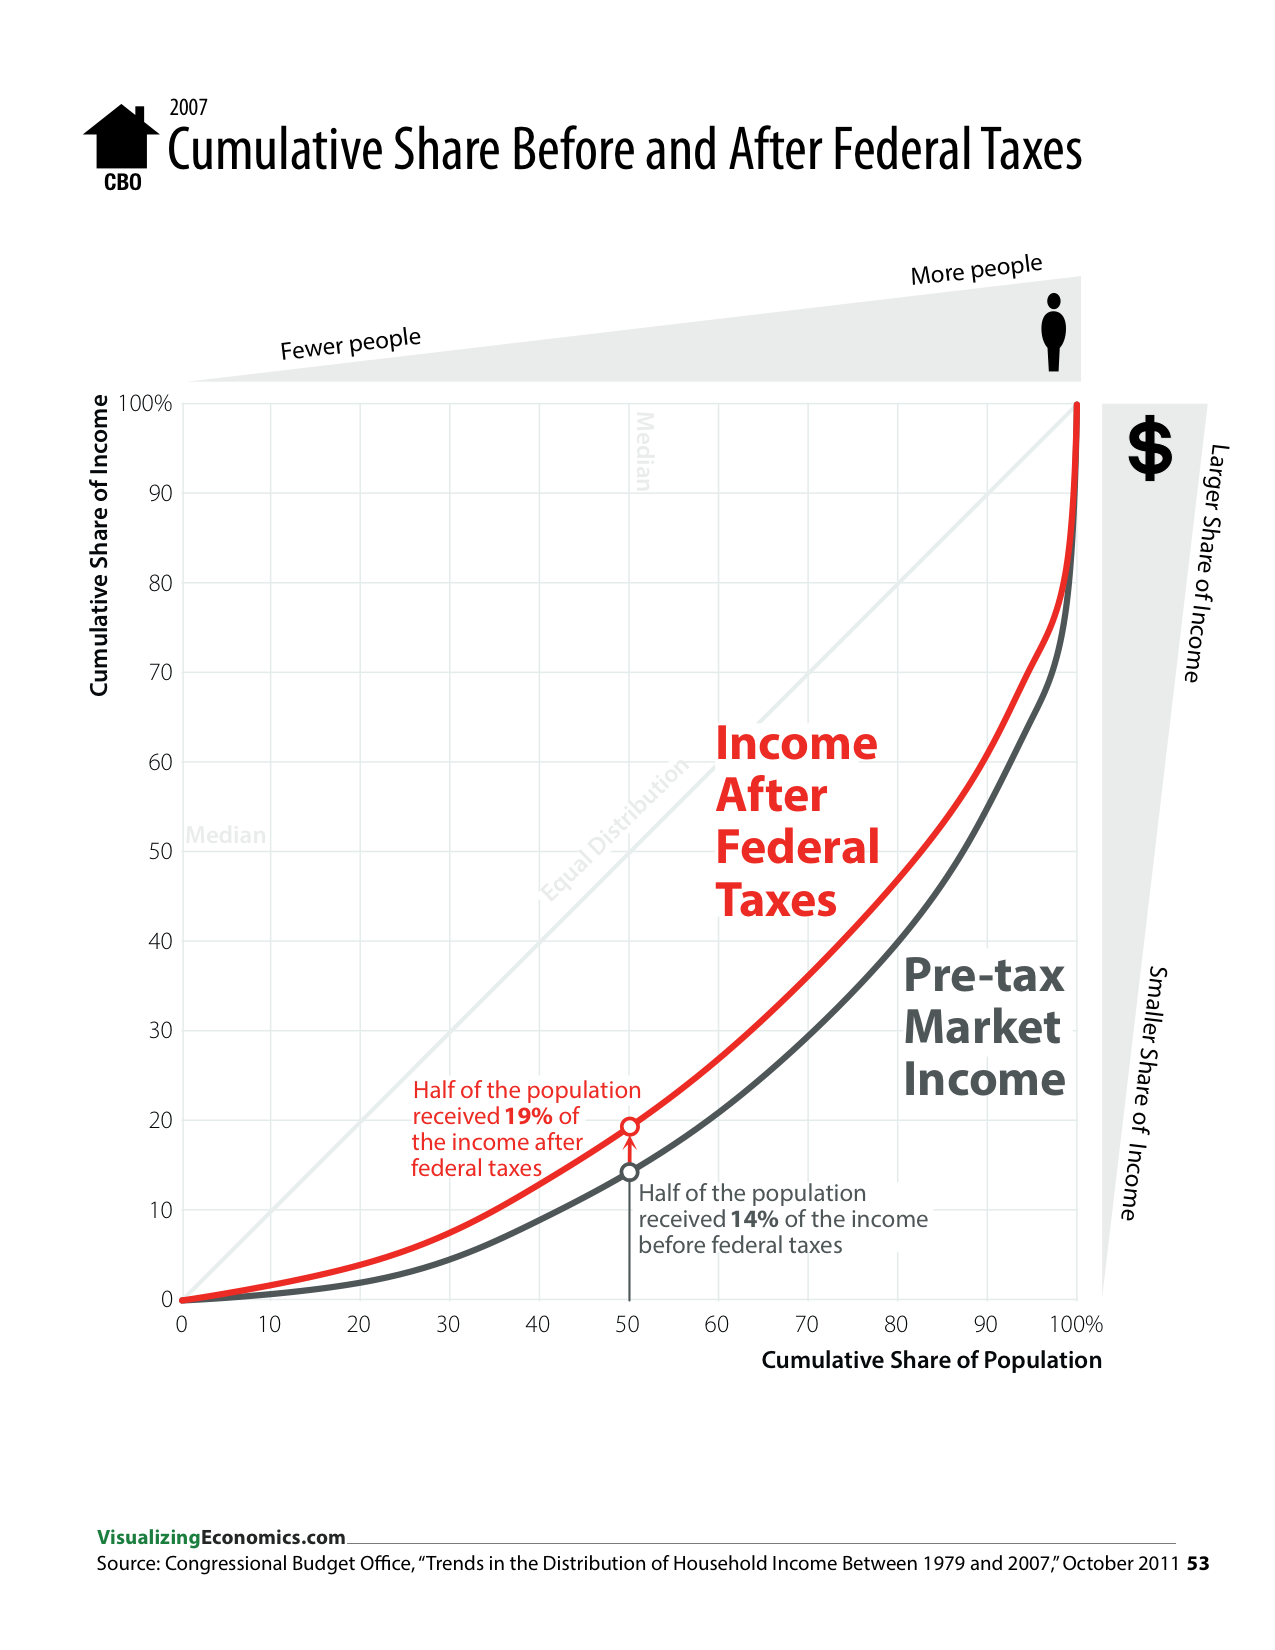
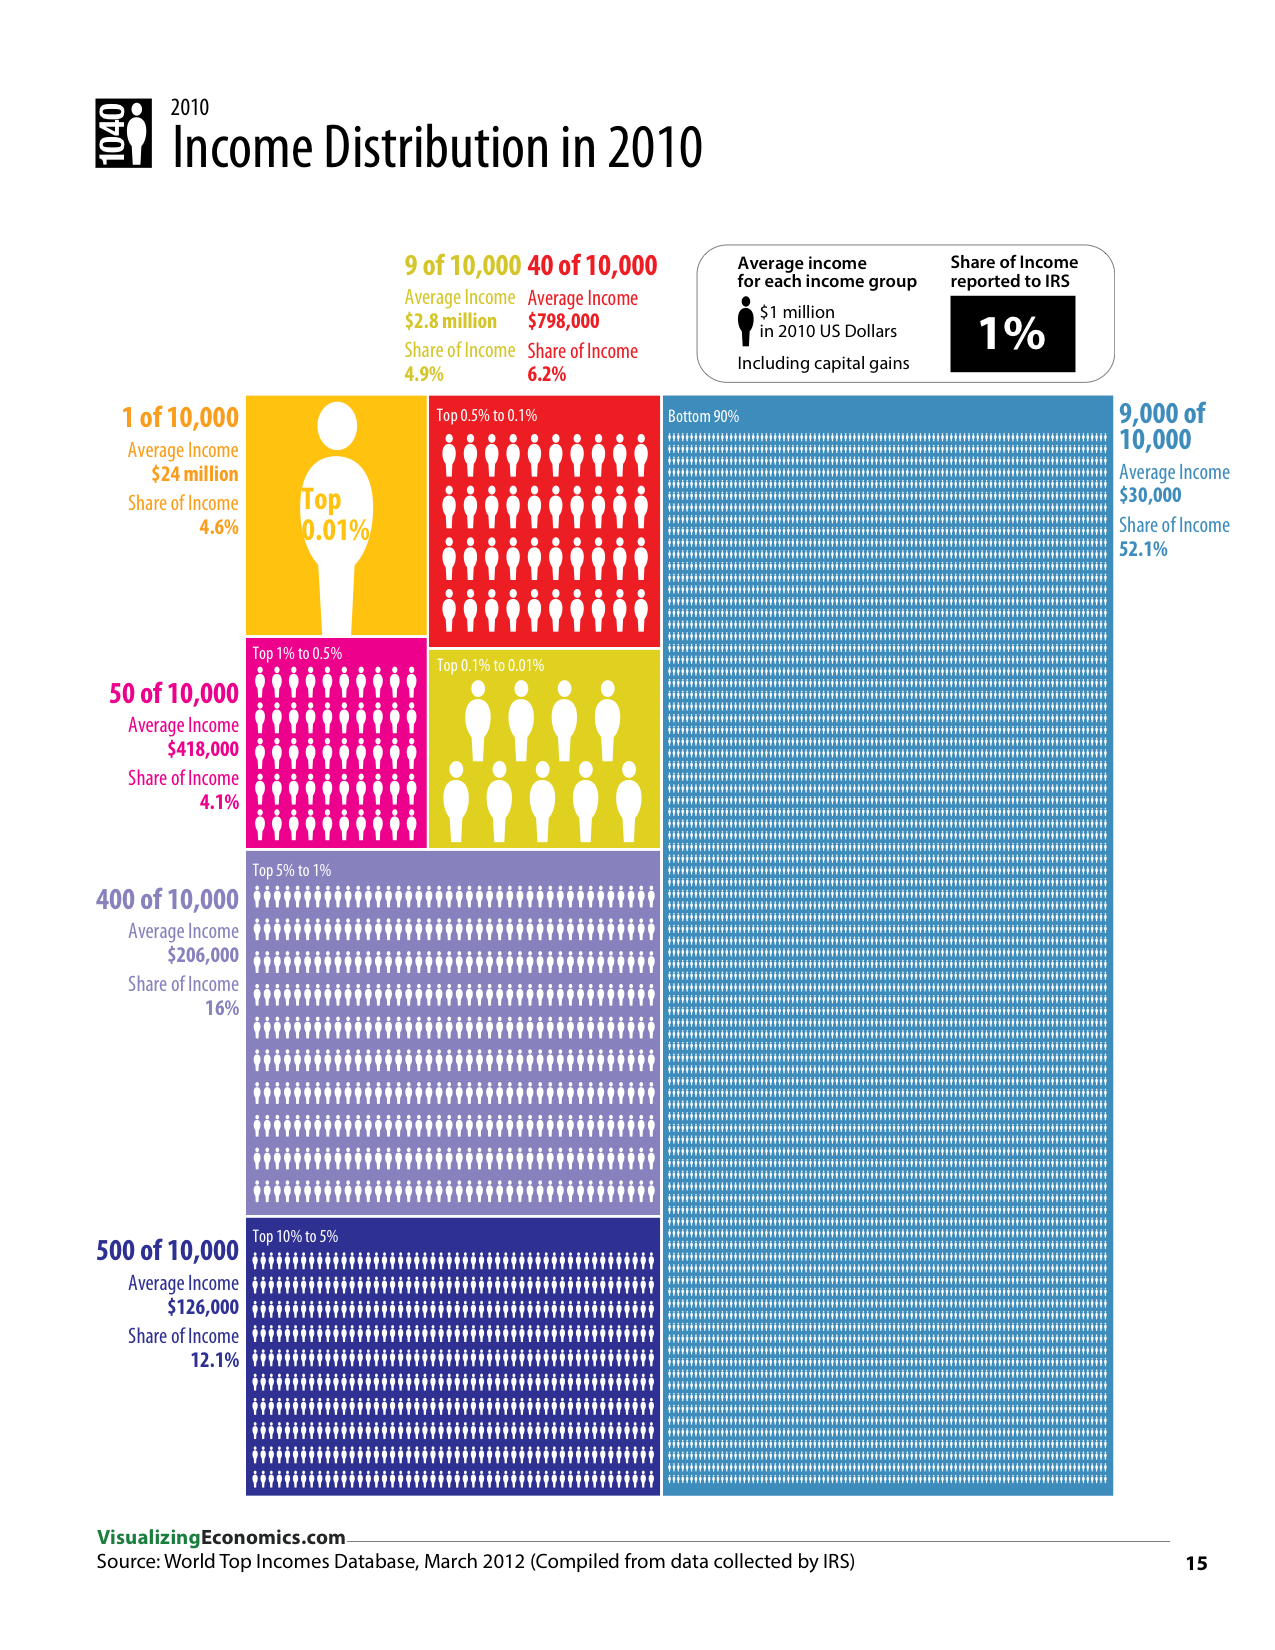
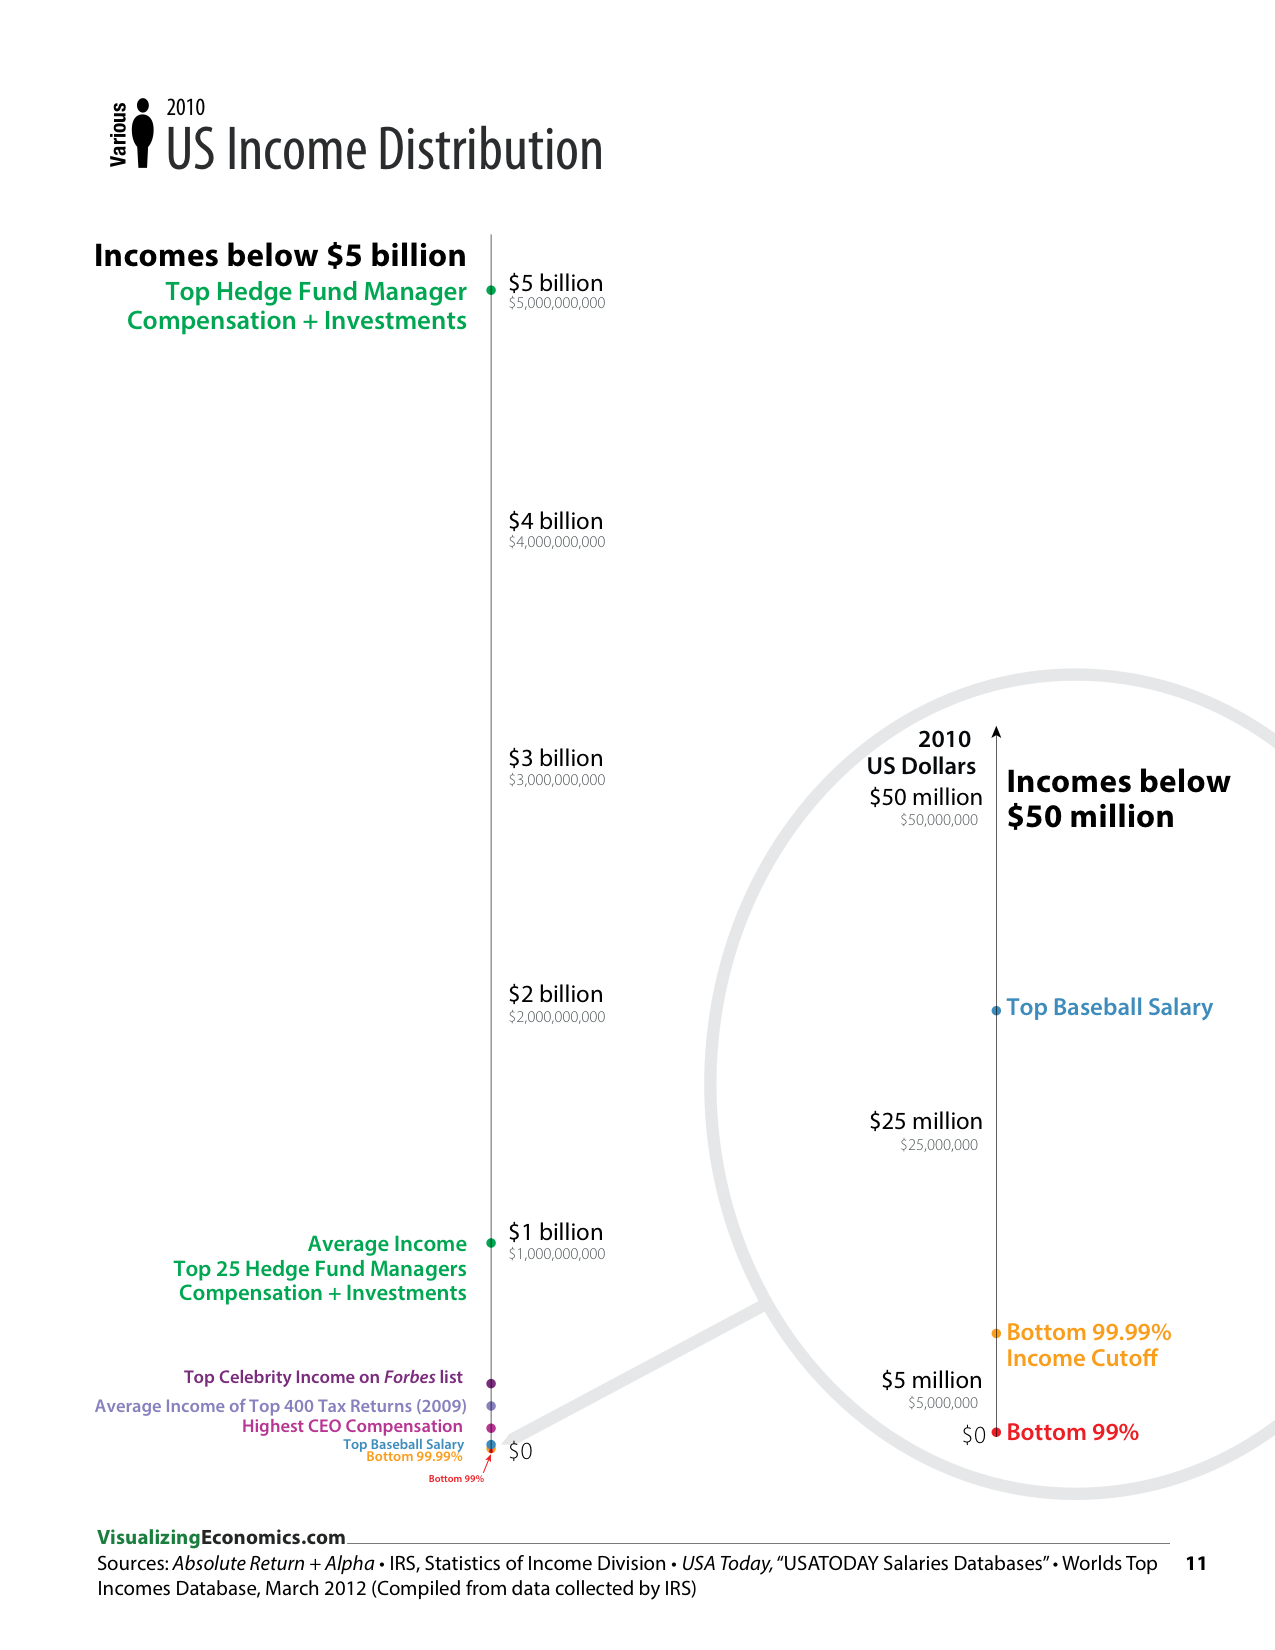
During the course of making my book, I tried to solve the problem of representing the extreme income inequality in the United States using several different graphic approaches. In some cases, I was working with a single data set like The World Top Incomes Database or the Congressional Budget Office. In others graphics, I combined this data with data from Forbes, IRS, and AR: Absolute Returns + Alpha.

Treemap was created using R and the people icons were added in Illustrator, while the cumulative share graphs and the dot plots were create in OmniGraphSkecher.


Related Posts Plugin for WordPress, Blogger...

All Sources of Income for Top 0.01 Percent

In my earlier post on Sources of Income of the super rich I plotted the percentage of income that comes from wages, entrepreneurial income, dividend income, interest income, rental income, and capital gains for the Top 0.01 percent. Here I am posting the same data but this time all income sources are on the same graph. {Click on the graph to take a closer look}

All Income Sources of top 0.01 percent

A few items that caught my attention: the decline (starting in the 1930s) of the importance of Dividend income which was replaced in part by "Entrepreneurial" income then Capitals Gains and finally in the 60s by Wages. Also in the 70s and 80s Interest income becomes more important no doubt due to the high interest rates during those decades.

The income data can be found on Emmanuel Saez's web site.

Related Posts Plugin for WordPress, Blogger...

Sources of Income for Top 0.01 Percent

In my earlier post on Sources of Income of the super rich I plotted the percentage of income that comes from wages, entrepreneurial income, dividend income, interest income, and rental income for the Top 0.01 percent; but this did not include capital gains. In 2005 capital gains was 18% of the income of the super rich (if you exclude capital gains when determining the Top 0.01 percent). In the graphs below, I have plotted the all 6 income sources for Top 0.01% (this time including capital gains as one of the income sources).

Income Sources of top 0.01 percent

The income data can be found on Emmanuel Saez's web site.

Related Posts Plugin for WordPress, Blogger...

Sources of Income for Top 0.01 Percent (excluding capital gains)

In my earlier post I plotted the percentage of income that comes from capital gains for the Top 0.01 percent. (In 2005 it was 18% if you exclude capital gains when determining the Top 0.01 percent and 51% if you include capital gains when determining the Top 0.01 percent). In the graphs below, I have plotted the other income sources for Top 0.01% (excluding capital gains when you rank the families). The question I am trying to answer: since most of the income was not from capital gains in the original graph, what are the sources of the unaccounted for income?

Income Sources of top 0.01 percent

The income data can be found on Emmanuel Saez's web site.


Related Posts Plugin for WordPress, Blogger...